Case Study: Medical - Blood Pressure Monitor Testing
Global leader of medical equipment received customer feedback on the manufacturers App stores which indicates that their customers are experiencing problems connecting their devices and synchronising the test results.With the dominance of the two leading phone manufacturers reducing and the increasing popularity of new brands, the need to perform interoperability tests on a wider range of devices is increasing.
Often, there is insufficient time and budget to perform nightly regression tests without automation.
ATAM provides the automation solution, by enabling the complete system to be verified from an end user perspective, without any manual intervention.

Test Setup
- ATAM monitors and controls both the App on the mobile devices (iOS and Android) as well as the device under test.
- The blood pressure monitor was instrumented by adding a digital interface to the User Buttons and Display. The digital interface allowed ATAM to ‘press’ the User Buttons and monitor what is shown on the Display in the same way that the end customer would.
- ATAM was also connected to mobile phones (iOS and Android) that were running the mobile Application. The App could be fully controlled by ATAM, with touchscreen presses and displayed text verified.
How the Test Functions
The following metrics were obtained from the tests:
Out-of-the-Box
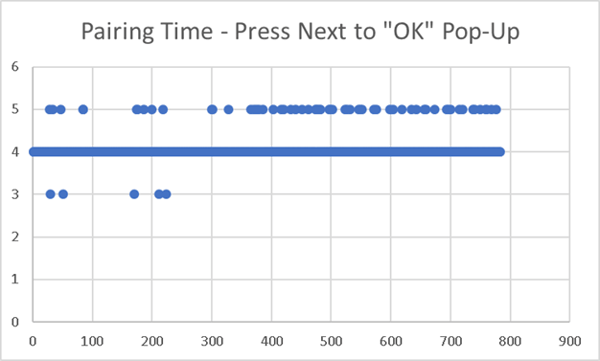
Pass/Fail success for the initial connection (pairing) of the device under test and a wide range of mobile devices over thousands of cycles. In addition to the pass/fail criteria, performance metrics are automatically generated. For example, the time to perform the pairing is automatically generated as an Excel chart.
Daily Use
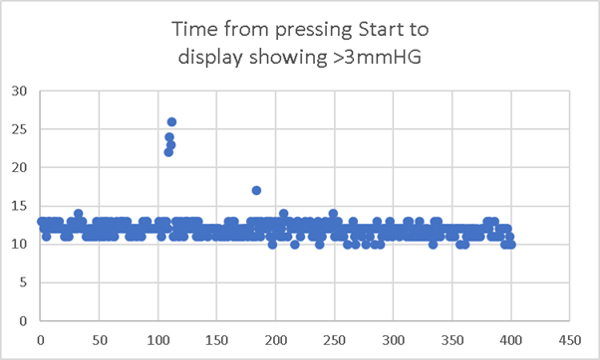
Operation of the blood pressure monitor ensuring that the pump and solenoids correctly operated to inflate the arm band. The time to reach a specific pressure was automatically displayed a chart. After the measurement was complete, ATAM verified that the new test results were correctly transferred to the mobile App running on the phone.
The Results
The out-of-the-box initial connection test was run 1000 times. The test failed in 20% of the test cycles, with the phone unable to connect with the device. This confirms the feedback from the customers on the manufacturers App store.
The following chart shows the time it took to connect for the 800 cycles where the connection was successful. The chart shows that the process is under control for successful connections with the spread of connection times being plus/minus 1 second.
The daily use test was executed 400 times. In the majority of cases, the time to inflate the arm band to 3mHg was 12 seconds. There was a small cluster of cases where the time to inflate took twice as long. The accompanying video and test logs can be used to help identify the root cause for this divergence.
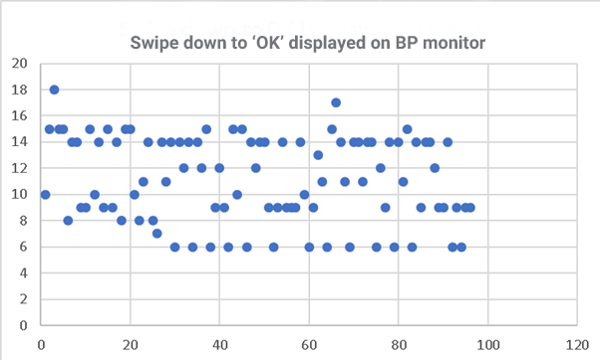
The second part of the daily use case, shows the time it takes to synchronise these test results back to the phone App. 100 cycles were performed. The transfer failed in 4 cycles (4% failure rate) which confirms the customer experience reported on the App store.
Conclusion
By using ATAM within the development process, the issues normally experienced by the customers can be reproduced in the lab and fixed before the product is launched.
By using ATAM within the nightly regression process, software and hardware releases can be made with the knowledge that the product will continue to operate without causing any new customer issues.

Share this post on:

